



 Custom Branding
Reporting and analytics services that turn data into plans
In digital marketing, success isn't about obtaining a lot of impressions and clicks. It's also recognising what's working, what's not, and what to do next. Our reporting and analysis services at Dreamial Marketing Agency help you make sense of the numbers, keep track of your ROI, and make decisions based on data that lead to growth.
Our key reporting and analytics services
We give you in-depth, real-time information that goes beyond vanity metrics to show you what really makes your digital business successful:

step 01
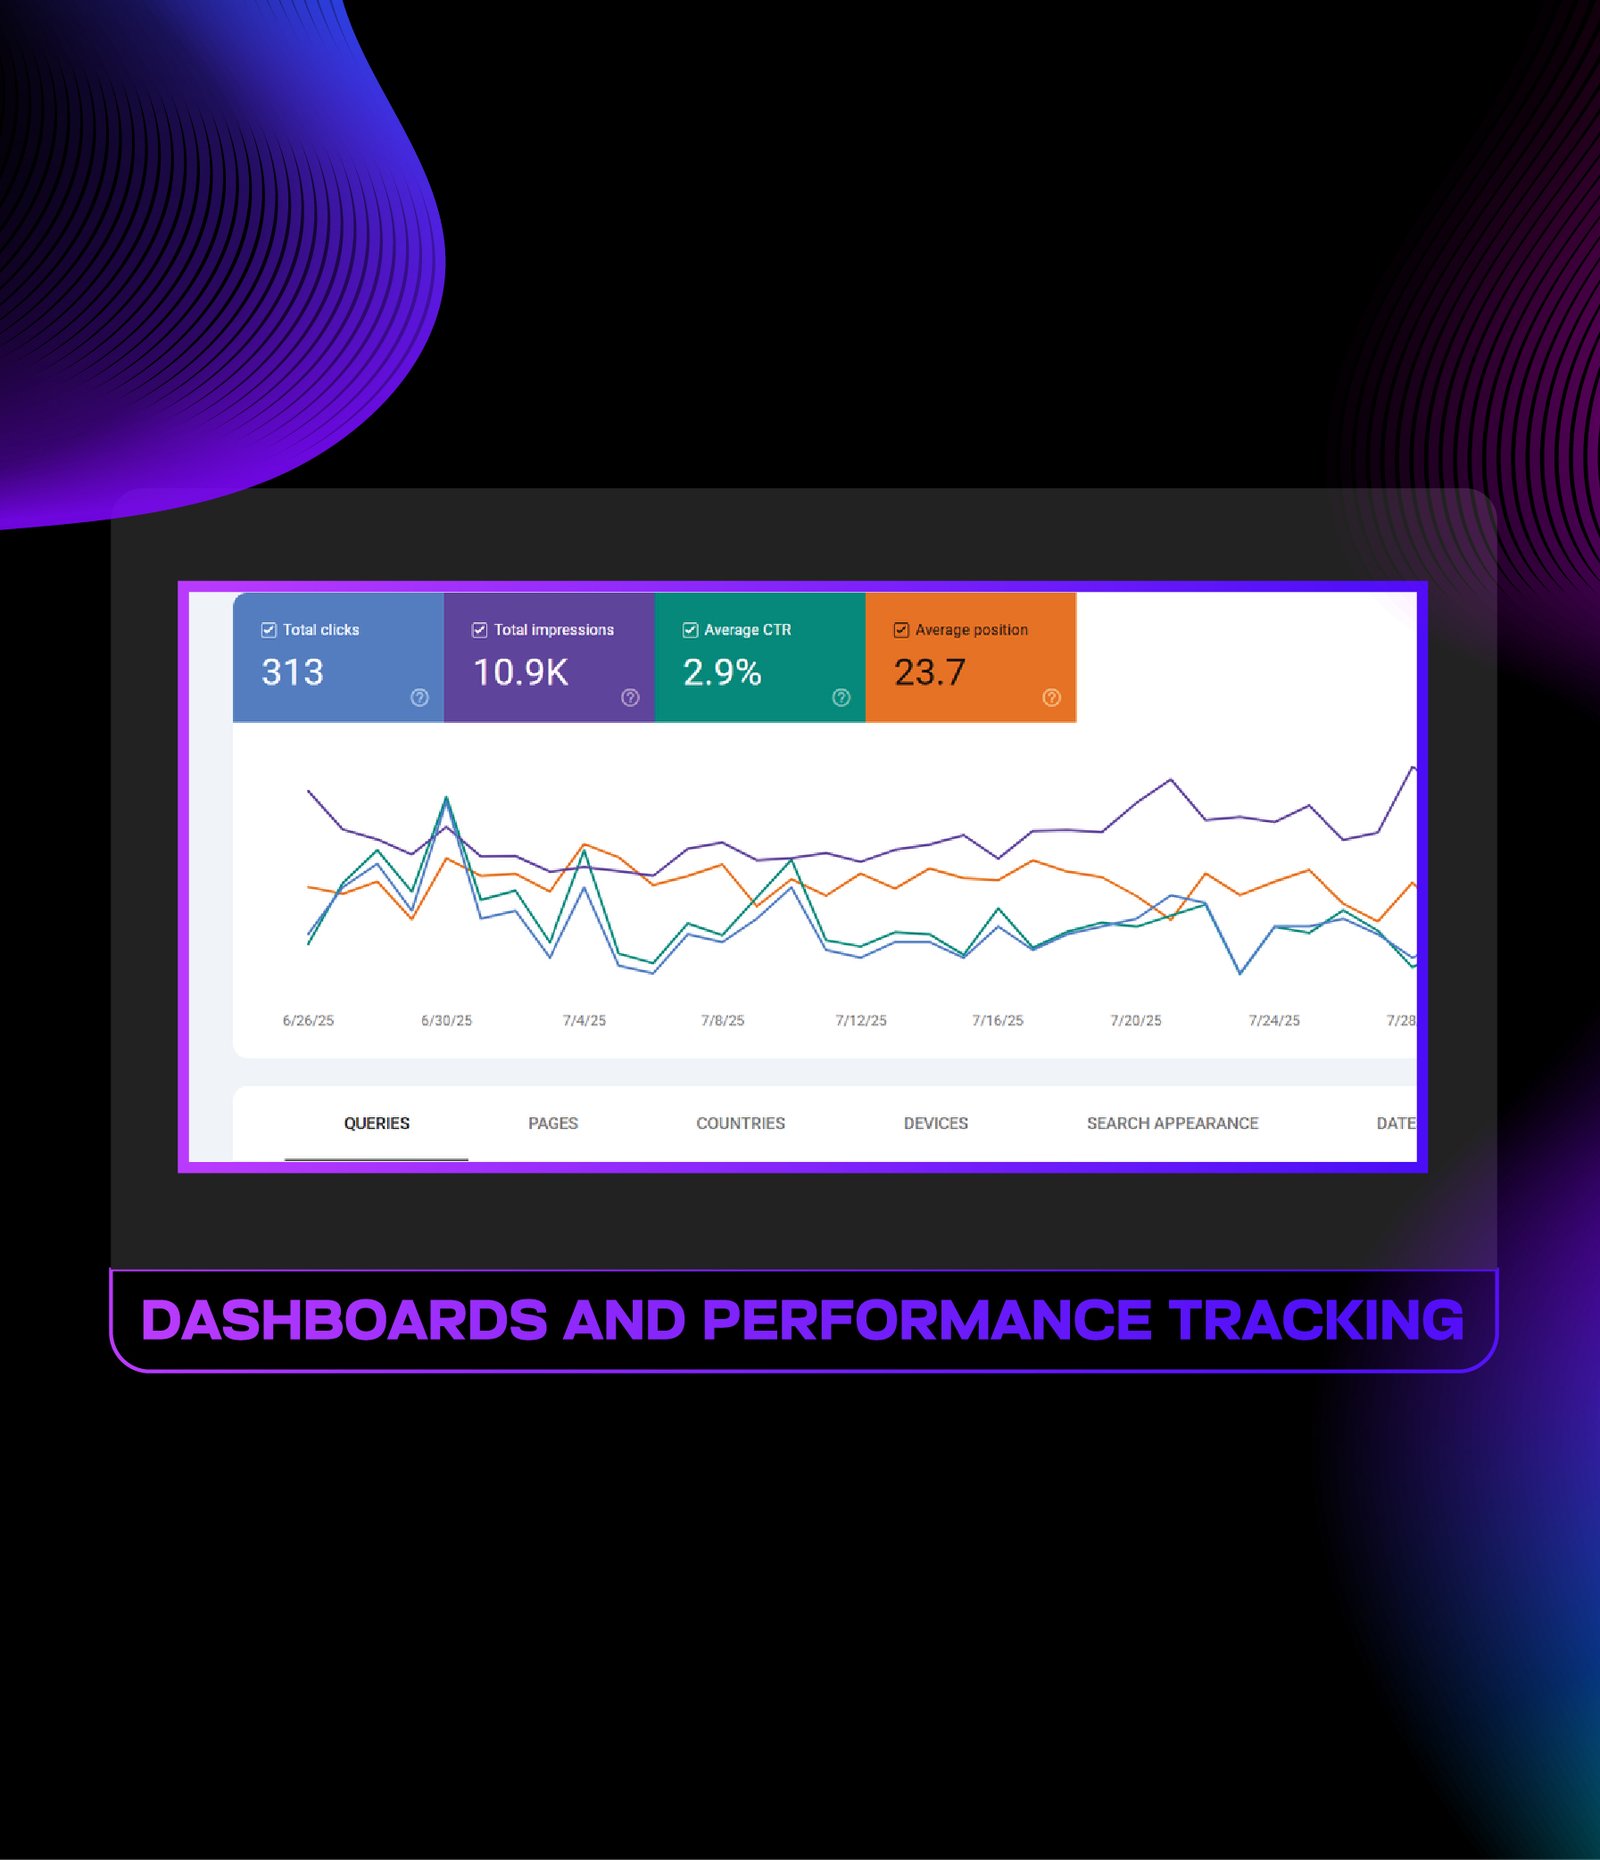
Dashboards and Performance Tracking
Using Google Looker Studio, GA4, Facebook Ads Manager, and other technologies, we develop bespoke dashboards to keep an eye on KPIs like traffic, conversions, bounce rate, and cost per acquisition (CPA).

step 02
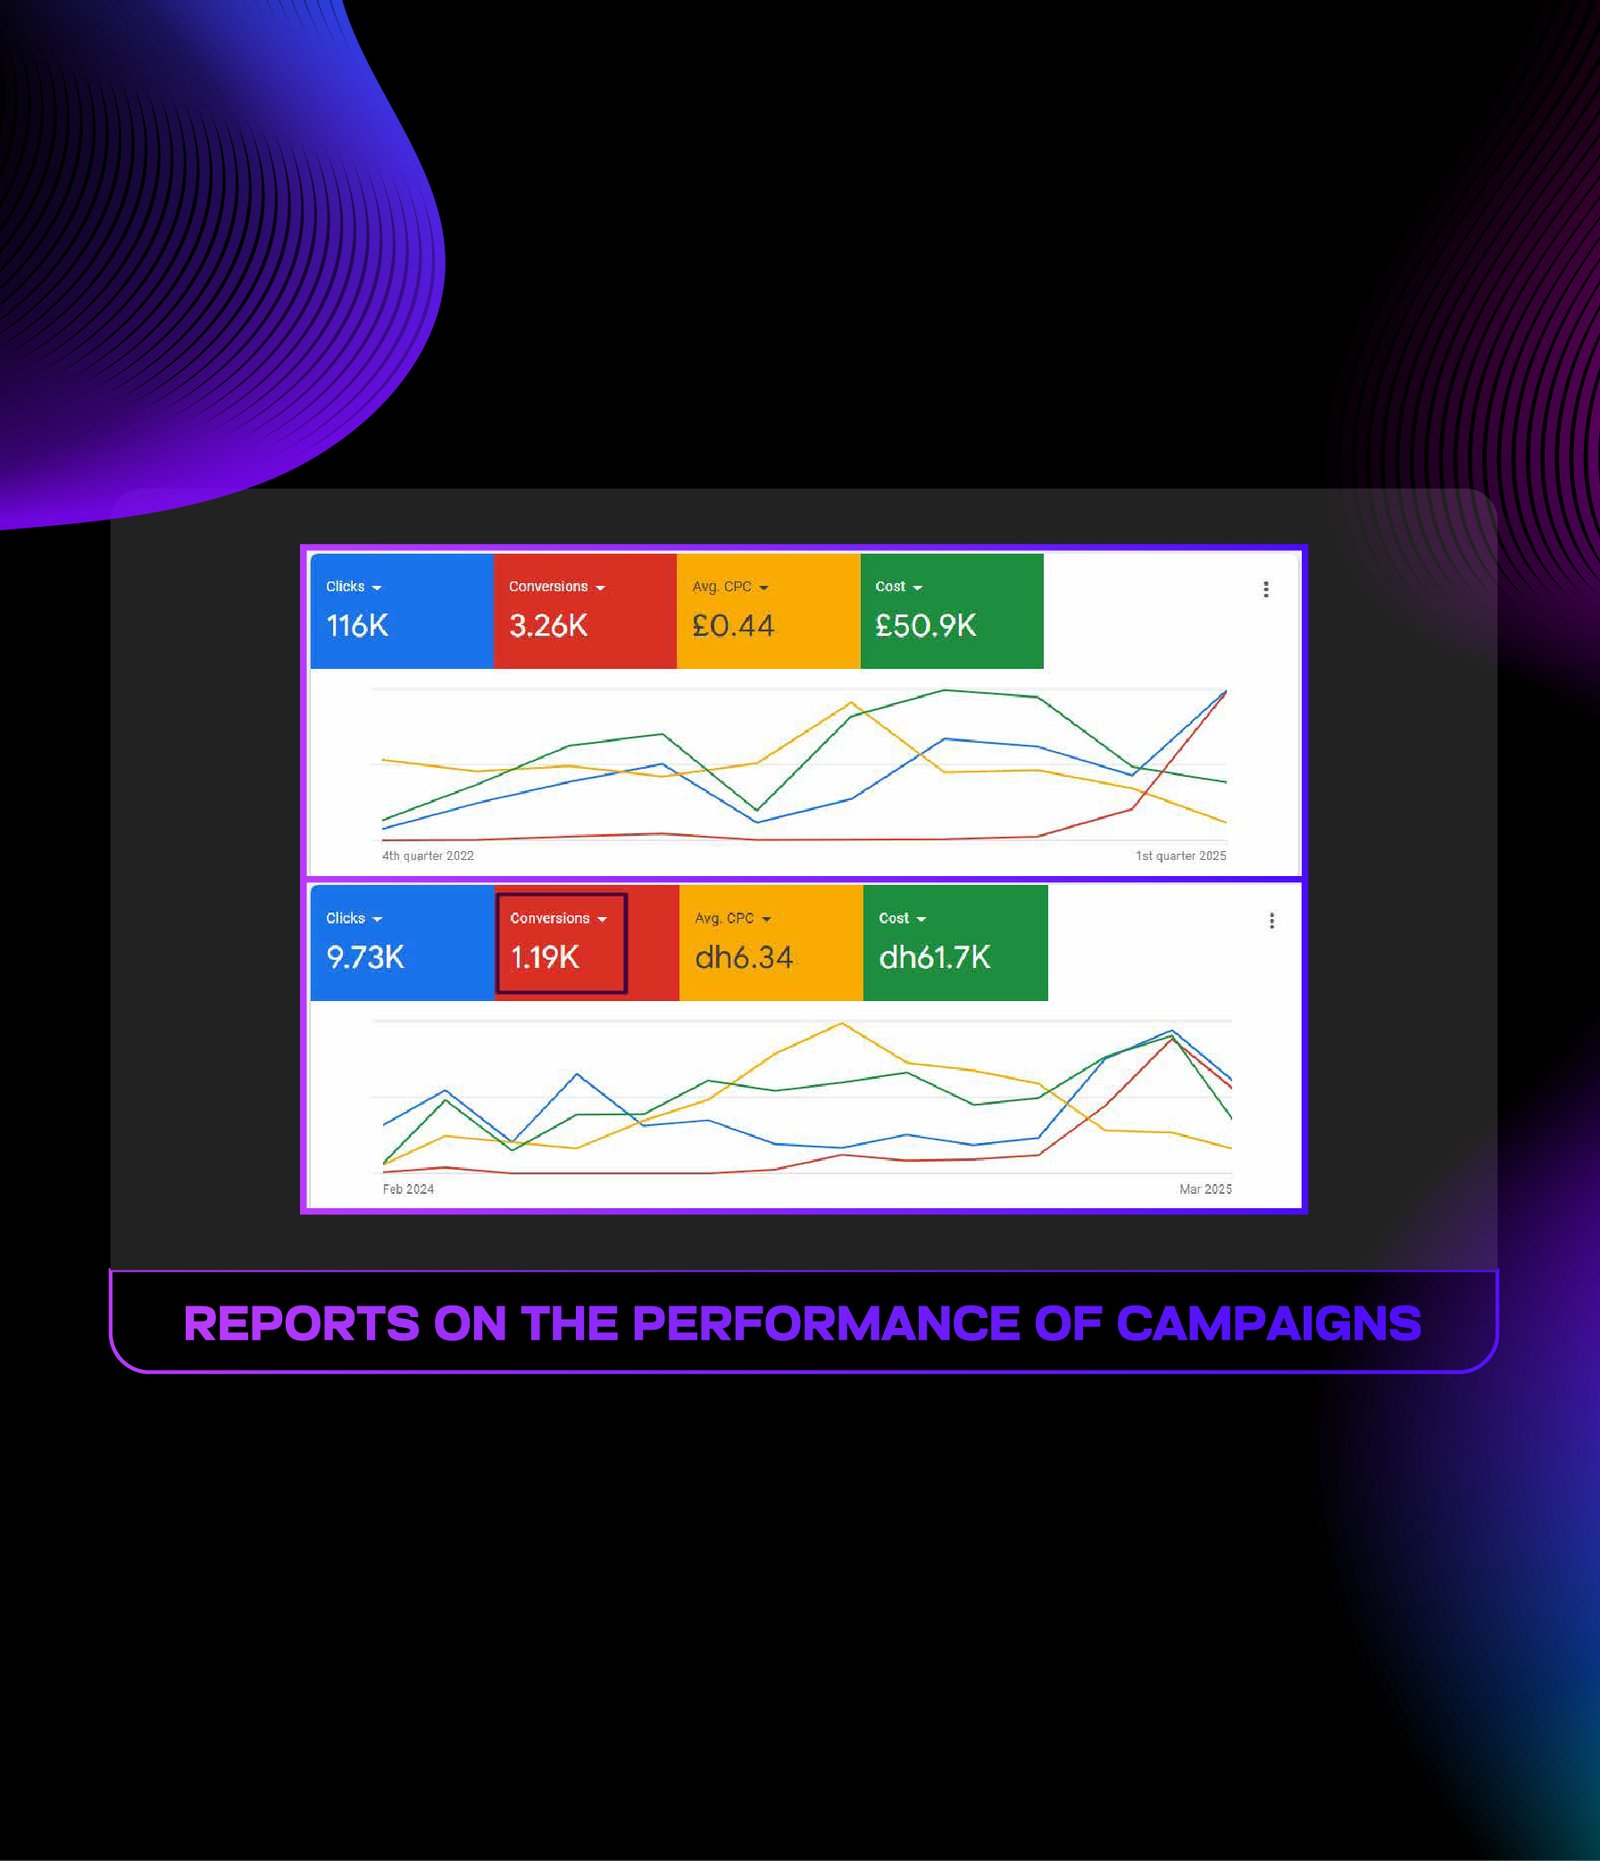
Reports on the performance of campaigns
Monthly or bi-weekly reports on SEO, PPC, social media, and email campaigns that offer insights, explanations, and professional advise.

step 03
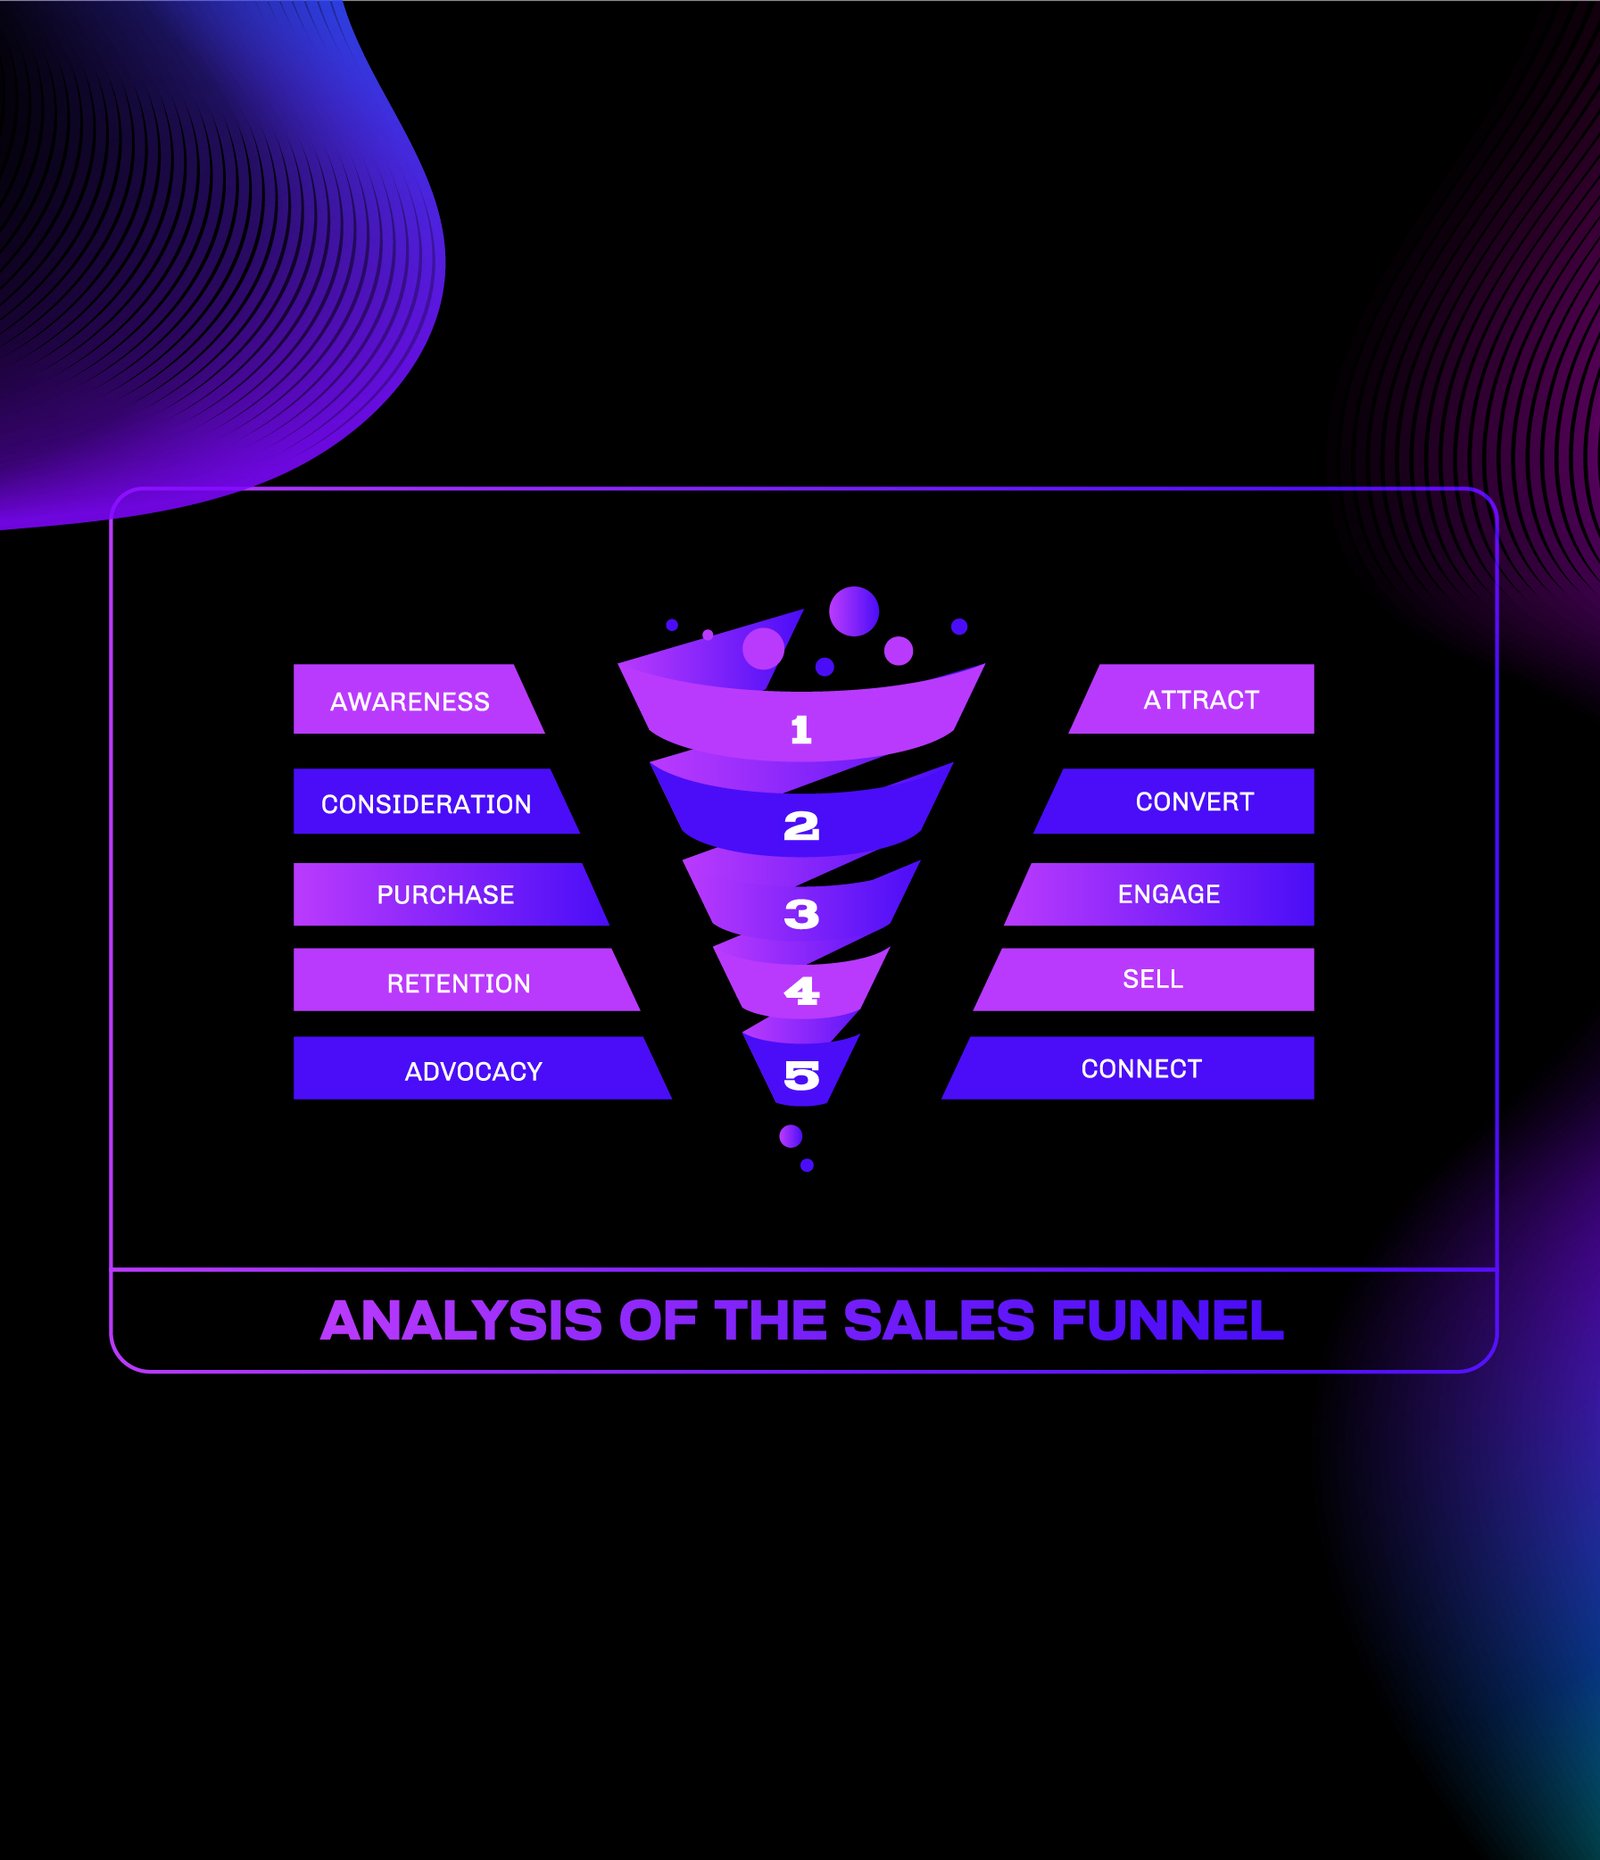
Analysis of the Sales Funnel
Follow how people act at every level, from being aware of your brand to converting. Find out where leads fall off and how to make the funnel operate better.
step 04
Comparing to competitors
Check how your digital performance matches up against that of your major competitors. We look at keyword share, backlinks, ad strategies, and how people connect with us on social media.

step 05
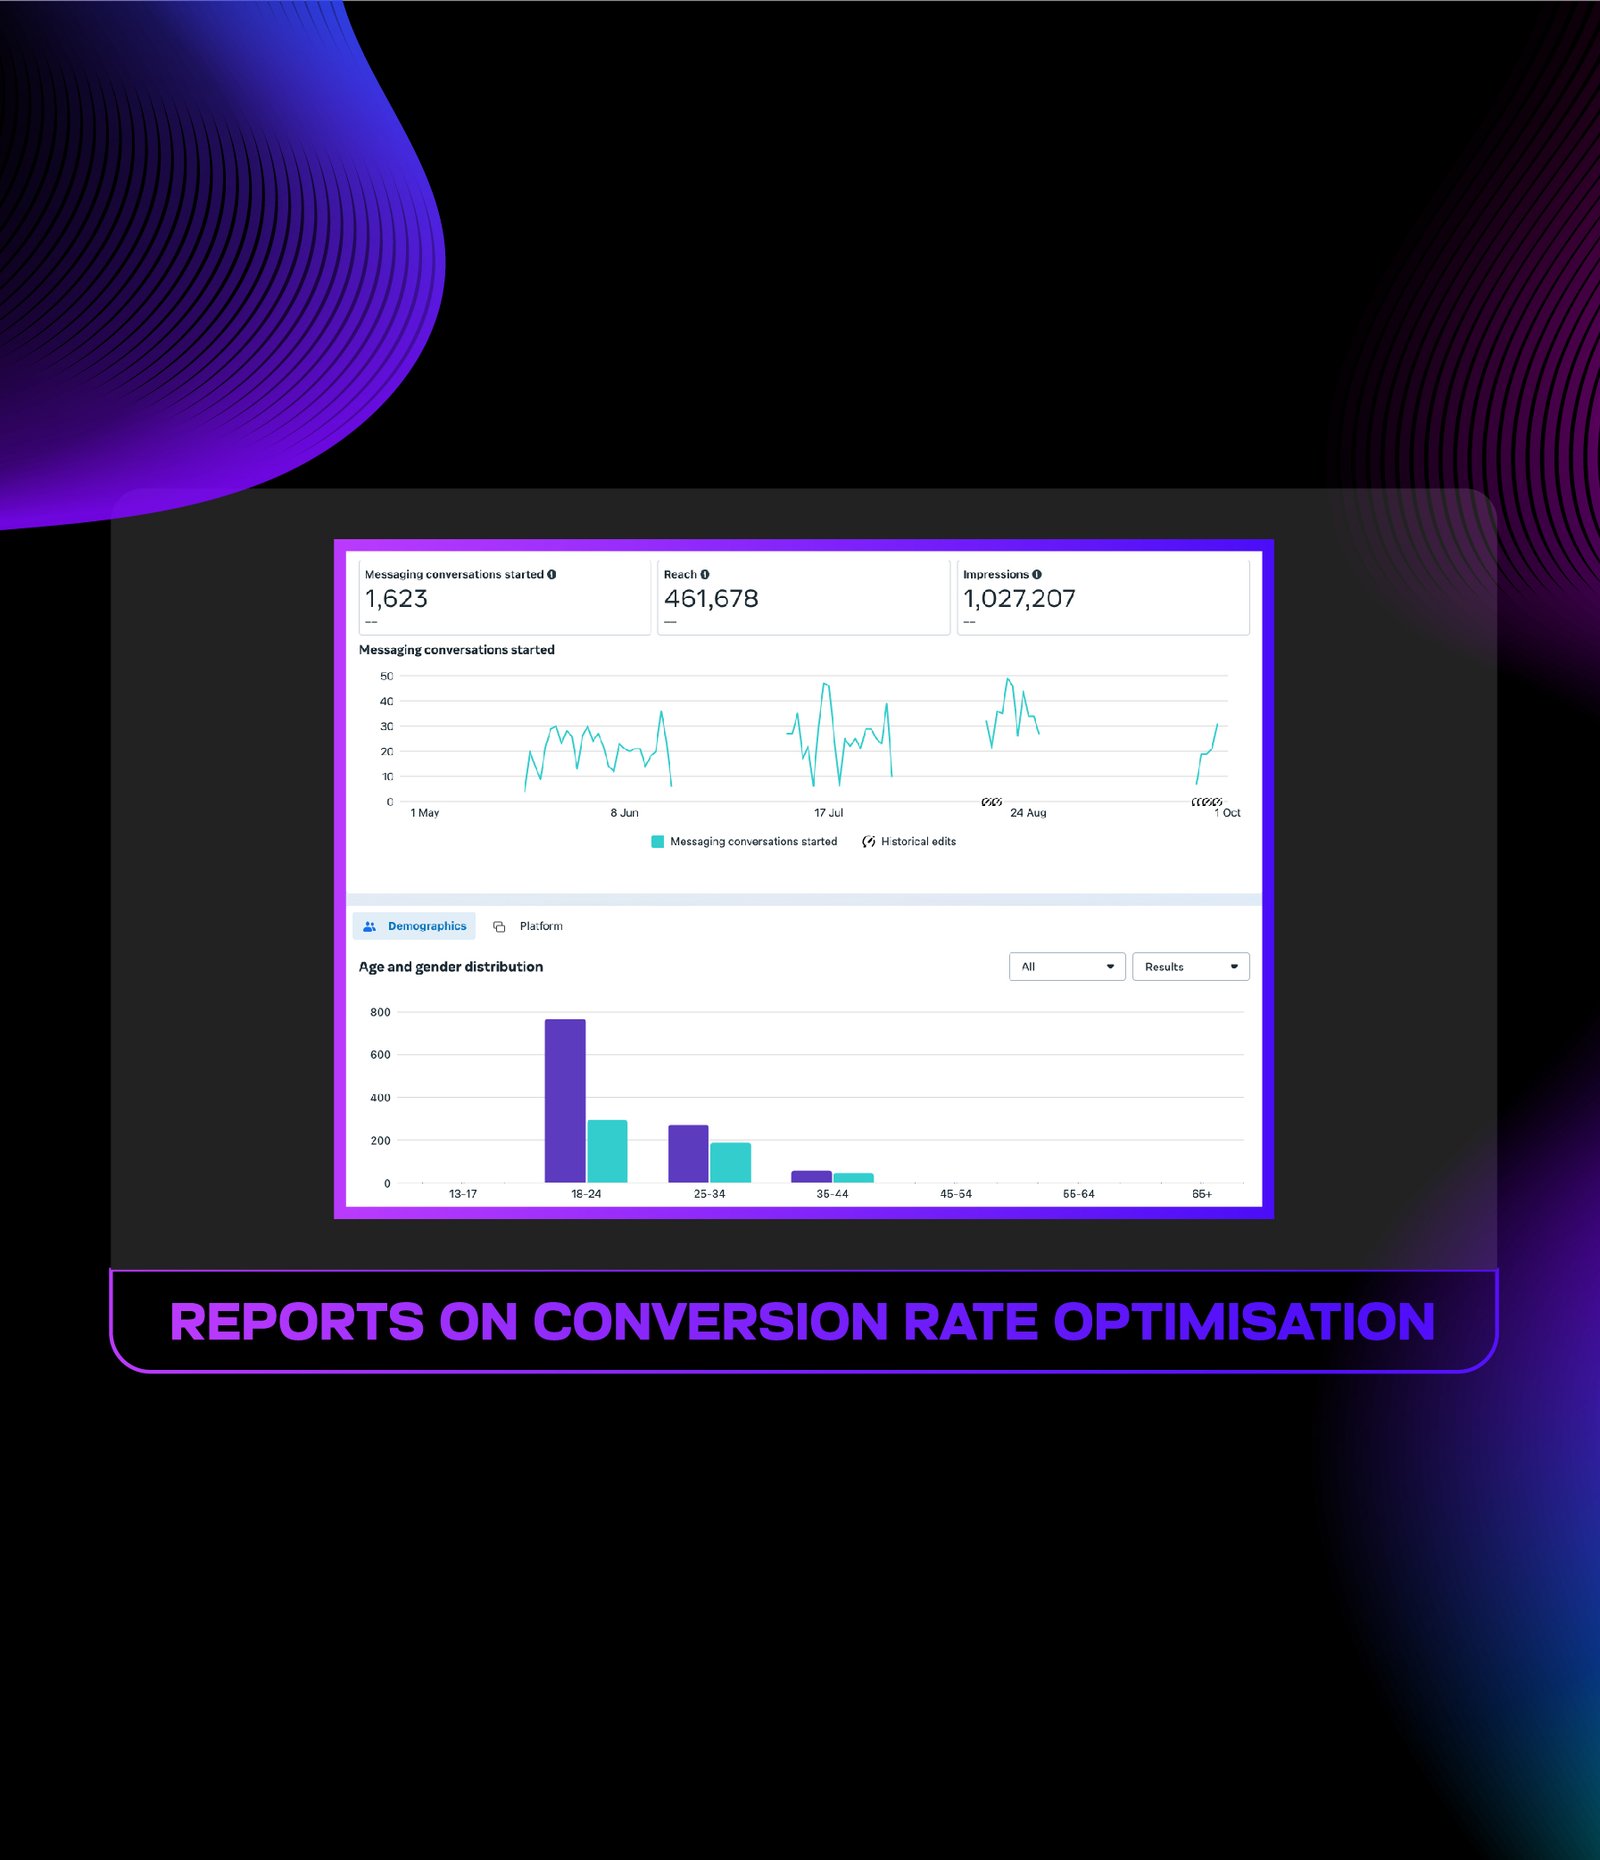
Reports on Conversion Rate Optimisation (CRO)
We uncover the areas of your website, landing pages, and ad creatives that are generating problems so you can attract more people to buy and spend less money on ads.
step 06
Custom Goal Tracking & Event Setup
We built up bespoke events and goals in GA4 and Tag Manager to keep track of the most critical items, like form submissions, calls, downloads, and sales.
Why use Dreamial for reporting and analysis?
We have looked at more than 500 marketing projects from diverse areas to assist organisations better their strategy and achieve higher return on investment.
We have Google-certified data analysts and marketing strategists on our team that know how to understand both figures and stories.
No more messy spreadsheets. Our reports are easy to read and include photographs, summaries, and suggestions for what to do next.
We don't simply offer you numbers; we explain them. Every insight is based on evidence, not opinions.
Lets address your questions today!
Reporting translates raw data into meaningful insights, showing how your campaign websites perform in metrics such as traffic, engagement, conversion and ROI. This highlights what is working, what improvement is required, and guides future decisions.
Specific reporting formats include: Campaign Performance Report (eg PPC, Social Media, SEO) - Reduce the results by the channel. Traffic and engagement metrics- how audiences interact on platforms. Conversion and ROI Matrix- Return on Advertising Expenditure (ROAS), and overall returns on investment (ROI). The dashboard and visual summary help to bring clarity in these insights.
Reporting frequency varies with campaign types and goals: Weekly updates are in line with rapidly growing campaigns.
It is common for menstrual running or long-term campaigns.
The quarterly and annual review helps identify trends over time.
Google Luker Saves Time and improves stability by using tools such as Google Luker Studio, Whatagraph, or AI-operated platforms.

 +92 306 9566763